analysis
Continue analysis of results.
Statistical analysis of normalized data showed no significant difference in caspase 9 or p53 expression between fed and fasted fish at time 0 week or time 14 week.
However, one fasted, 14 week sample showed very low beta actin expression beta actin outlier resulting in very high normalized expression of caspase 9 and p53 for that sample and high standard errors . Analysis of the beta actin data point showed it was not a significant outlier (grubbs test for detecting outliers http://www.graphpad.com/quickcalcs/grubbs2.cfm), however, when caspase 9 and p53 expression was normalized to the beta actin value, these data points became significant outliers outliers . Therefore, the data point was omitted from the analysis resulting in the following:
| beta_actin |
mean |
st_error_mean |
| time_0_fed |
0.071 |
0.008 |
| time_0_fasted |
0.066 |
0.012 |
| time_14_fed |
0.060 |
0.007 |
| time_14_fasted |
0.074 |
0.010 |
| caspase9 |
mean |
st_error_mean |
| time_0_fed |
0.787 |
0.055 |
| time_0_fasted |
0.934 |
0.143 |
| time_14_fed |
0.674 |
0.064 |
| time_14_fasted |
1.162 |
0.150 |
| p53 |
mean |
st_error_mean |
| time_0_fed |
1.545 |
0.238 |
| time_0_fasted |
1.273 |
0.111 |
| time_14_fed |
0.722 |
0.083 |
| time_14_fasted |
1.261 |
0.143 |
Subsequent statistical analysis showed that when the outlier was omitted, expression levels of caspase 9 (Welch's t-test, t=-2.996, p=0.017) and p53 (Welch's t-test, t=-3.256, p=0.0086) were significantly higher in fasted fish at 14 weeks.
Week 8: Wednesday 25 November 2009
qPCR
Analyze results from last week and continue with additional qPCR.
Primers for bax and p53 arrived. Yoji tested product specificity of primers with regular PCR. p53 had one clean band, but bax did not show amplification indicating that the primer (designed from rainbow trout) was not a good match for coho salmon. Therefore, we will only perform qPCR on p53 today.
1. prepared master mix as below.
2. put 21uL master mix in rows A through D.
3. added 4uL of standard concentrations (1ng, 0.1ng, 0.01ng, and 0.001ng in triplicate) into row A (as below)
4. added 4uL of sample to rows B, C, and D from master plate (from master plate rows F, G, and H due to possible contamination of controls in row D).
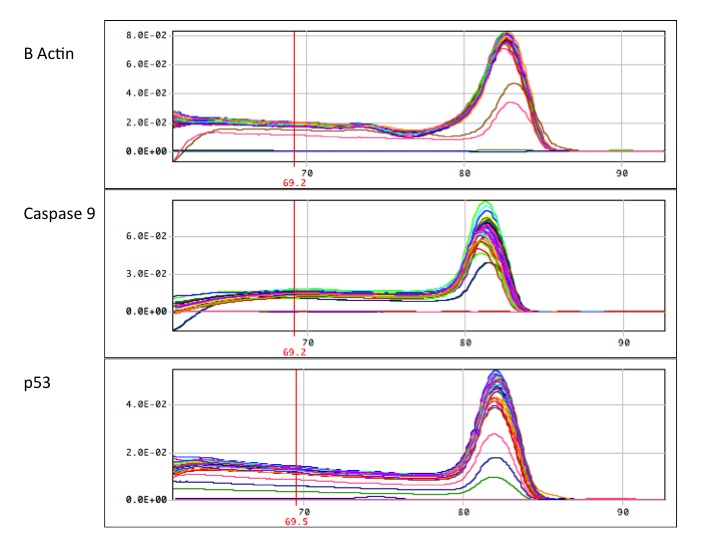
The good news, is that in each qPCR reaction, there is a single peak. Unfortunately, some contamination is present in some reactions, in some controls. For example, in the beta actin graph, the brown and pink lines are controls. one is a "no amplification control" containing RNA (not cDNA) and a "no template control" containing only water. However, two of the NACs showed no amplification. This indicates some contamination during pipetting or contamination via adjacent cells. However, the two clean NACs indicate that there was no significant genomic carry over and the water was not contaminated. The caspase 9 graph had no contamination in any of the NACs or in the NTC. Therefore the contamination could have been in the top half of the master plate (so for the p53 reaction, we used the bottom half of the master plate). Additionally, in the beta actin graph you can see a small dip before the peak. This can be an indication of some small primer dimer interaction or some other inefficiency in the pcr reaction.
Analysis of the standard curve showed R-squared values above 99% indicating minimal variation due to pipetting error.
Gene expression levels of the eight individual fish in each treatment were averaged and are as follows:
| beta_actin |
mean |
st_error_mean |
| time_0_fed |
0.071 |
0.008 |
| time_0_fasted |
0.066 |
0.012 |
| time_14_fed |
0.060 |
0.007 |
| time_14_fasted |
0.065 |
0.012 |
| caspase9 |
mean |
st_error_mean |
| time_0_fed |
0.787 |
0.055 |
| time_0_fasted |
0.934 |
0.143 |
| time_14_fed |
0.674 |
0.064 |
| time_14_fasted |
1.693 |
0.546 |
| p53 |
mean |
st_error_mean |
| time_0_fed |
1.545 |
0.238 |
| time_0_fasted |
1.273 |
0.111 |
| time_14_fed |
0.722 |
0.083 |
| time_14_fasted |
2.020 |
0.769 |
statistical analysis showed no significant differences in gene expression between fed and fasted fish at 0 weeks (beta actin p=0.747, caspase 9 p=0.363, p53 p=0.325) or 14 weeks (beta actin p=0.683, caspase 9 p=0.106, p53 p=0.137).
future steps: continue analysis. prepare presentation.
Week 7: Wednesday 18 November 2009
Meeting with Yoji and Penny
Finalize project plans and design/order necessary primers
Ironed out final project plans. Will analyze intrinsic apoptosis pathway (p53, caspase 9, and bax) in ovarian tissue of fed and fasted fish using qPCR of reverse transcribed mRNA. Preliminary trials will look at two time points (0 weeks and 14 weeks).
Designed (using primer3 online primer design software) and ordered primers for p53 using sequence from O. kisutch (AF071572) and bax from O. mykiss (no sequence for coho could be found).
Next steps: meeting next day to begin qPCR of caspase 9 expression and normalizing (housekeeping gene).
Week 7: Thursday 19 November 2009
qPCR with Yoji
Perform qPCR on caspase 9 and ß-actin (housekeeping gene).
mRNA had previously been isolated from total RNA of individual fed and fasted fish and reverse transcribed to cDNA and tested for genomic carry over.
1. diluted cDNA 1:400 by pipetting 0.5µL cDNA into 199.5µL nuclease free water for all 32 samples (8 individuals from each treatment: fed 0 week, fasted 0 week, fed 14 week, fasted 14 week). Part way through this process, noticed that the pipetman was not drawing up the correct volume reliably. Yikes. remeasured a subset of the samples and switched to a different pipetman. Some pipette error undoubtedly remains.
2. prepared 3 "no amplification" controls by diluting 1:400 (to double check for genomic contamination) using samples that lacked superscript during RT reaction.
3. prepared "no template" controls (just nuclease free water)
4. created a basic PCR plate with enough sample for 10 PCR reactions (40µL of each sample) for easier PCR setup of subsequent PCR runs.
| gene name |
1 |
2 |
3 |
4 |
5 |
6 |
7 |
8 |
9 |
10 |
11 |
12 |
|
| A |
|||||||||||||
| B |
0wk #1 |
0wk #6 |
0wk #9 |
0wk #12 |
0wk #13 |
0wk #14 |
0wk #15 |
0wk #17 |
0wk #25 |
0wk #26 |
0wk #27 |
0wk #28 |
|
| C |
0wk #31 |
0wk #34 |
0wk #35 |
0wk #37 |
14wk #5 |
14wk #8 |
14wk #11 |
14wk #14 |
14wk #17 |
14wk #18 |
14wk #19 |
14wk #21 |
|
| D |
14wk #23 |
14wk #25 |
14wk #26 |
14wk #27 |
14wk #31 |
14wk #36 |
14wk #37 |
14wk #42 |
NAC1 |
NAC2 |
NAC3 |
NTC |
|
| E |
|||||||||||||
| F |
0wk #1 |
0wk #6 |
0wk #9 |
0wk #12 |
0wk #13 |
0wk #14 |
0wk #15 |
0wk #17 |
0wk #25 |
0wk #26 |
0wk #27 |
0wk #28 |
|
| G |
0wk #31 |
0wk #34 |
0wk #35 |
0wk #37 |
14wk #5 |
14wk #8 |
14wk #11 |
14wk #14 |
14wk #17 |
14wk #18 |
14wk #19 |
14wk #21 |
|
| H |
14wk #23 |
14wk #25 |
14wk #26 |
14wk #27 |
14wk #31 |
14wk #36 |
14wk #37 |
14wk #42 |
NAC1 |
NAC2 |
NAC3 |
NTC |
6. Diluted primers to 3.75µM stock by adding 15µL to 385µL nuclease free water.
7. Prepared master mix for each gene (B-actin and caspase 9)
| Syber_MasterMix |
per_rxn |
51_rxns |
|
| Power_SyBr_(2x) |
12.5uL |
637.5uL |
|
| Sigma water |
6.5uL |
331.5 |
|
| F_primer |
1uL |
51uL |
|
| R_primer |
1uL |
51uL |
8. Added 21µL Syber Master mix to rows A,B,C,D (B-actin) and E,F,G,H (caspase 9) of 96 well plate.
9. transfered 4µL of each sample from PCR master plate to new PCR plate.
| gene_name |
1 |
2 |
3 |
4 |
5 |
6 |
7 |
8 |
9 |
10 |
11 |
12 |
|
| A |
1 ng |
1 ng |
1 ng |
0.1 ng |
0.1 ng |
0.1 ng |
0.01 ng |
0.01 ng |
0.01 ng |
0.001 ng |
0.001 ng |
0.001 ng |
|
| beta actin |
B |
0wk #1 |
0wk #6 |
0wk #9 |
0wk #12 |
0wk #13 |
0wk #14 |
0wk #15 |
0wk #17 |
0wk #25 |
0wk #26 |
0wk #27 |
0wk #28 |
| beta actin |
C |
0wk #31 |
0wk #34 |
0wk #35 |
0wk #37 |
14wk #5 |
14wk #8 |
14wk #11 |
14wk #14 |
14wk #17 |
14wk #18 |
14wk #19 |
14wk #21 |
| beta actin |
D |
14wk #23 |
14wk #25 |
14wk #26 |
14wk #27 |
14wk #31 |
14wk #36 |
14wk #37 |
14wk #42 |
NAC1 |
NAC2 |
NAC3 |
NTC |
| E |
1 ng |
1 ng |
1 ng |
0.1 ng |
0.1 ng |
0.1 ng |
0.01 ng |
0.01 ng |
0.01 ng |
0.001 ng |
0.001 ng |
0.001 ng |
|
| caspase 9 |
F |
0wk #1 |
0wk #6 |
0wk #9 |
0wk #12 |
0wk #13 |
0wk #14 |
0wk #15 |
0wk #17 |
0wk #25 |
0wk #26 |
0wk #27 |
0wk #28 |
| caspase 9 |
G |
0wk #31 |
0wk #34 |
0wk #35 |
0wk #37 |
14wk #5 |
14wk #8 |
14wk #11 |
14wk #14 |
14wk #17 |
14wk #18 |
14wk #19 |
14wk #21 |
| caspase 9 |
H |
14wk #23 |
14wk #25 |
14wk #26 |
14wk #27 |
14wk #31 |
14wk #36 |
14wk #37 |
14wk #42 |
NAC1 |
NAC2 |
NAC3 |
NTC |
11. Yoji started PCR machine.
Next steps: analyze qPCR results and troubleshoot. perform qPCR on bax and p53
Week 6: Tuesday 10 November 2009
Meeting with Yoji
Discuss project possibilities/potential genes of interest
Previously, Penny suggested using week 17 mRNA because Yoji said he was low on week 14 mRNA. However, at week 17, fed and fasted fish oocytes are at different stages complicating analysis of differences. Is gene expression different because of different stage or because of stress? There is plenty of total RNA from 14 week, so we will use total RNA from 14 week to simplify analysis.
Yoji has analyzed the steroidogenic pathway and the extrinsic apoptosis pathway with qPCR at all time points. Suggested pathways of interest include the intrinsic apoptosis pathway(p53, bax, hsp70, caspase 9). Also, liver and pituitary tissues are available which would allow comparison of glucocorticoid receptor isoform regulation in different tissues.
Next directions: Waiting to find out which primers have already been ordered and which still need to be designed and ordered. Waiting to find out when I can carry out lab work at NWFSC. Am aiming to perform preliminary PCR this week on intrinsic apoptosis pathway (HSP70)
Week 5: Tuesday 3 November 2009
Quantitative PCR
perform qPCR
1. Prepare master mix (enough for 8 reactions)
Add: 200µL 2X Immomix, 24µL Syto-13 dye, 20µL 10µM forward primer, µL 10µM reverse primer, 120µL PCR water.
2. Add 48µL master mix to 6 wells of PCR plate
3. Add 2µL of cDNA template to two wells (A9 + B9)
4. Add 2µL of PCR water to negative controls (C9 + D9)
5. Add 2µL of RNA to two wells to check for genomic contamination (E9 + F9)
6. Cap the wells securely
7. load the plate
8. Run PCR
PCR parameters:
95C for 10 minutes
40 times:
- 95C for 15 seconds
- 55C for 15 seconds
- read
- 72C for 30 seconds
- read
95C for 1 minute
55C for 1 second
- manual ramp rate of 0.2C per second
Melting curve from 55C to 95C. Read every 0.5C hold 30 seconds
Results:
Louisa's qPCR results
9A and 9B which had cDNA template show amplification. 9A shows two peaks (one around 76C and the other around 83C) while 9B only shows one major peak at 76C. 9C and 9D were negative controls and do not show amplification above background. 9E and 9F contained RNA sample and should not have amplified unless genomic carry over was present. 9E and 9F did show a peak around 83C similar to 9A and 9B indicating the presence of genomic DNA. The two peaks in 9A could indicate amplification of cDNA (the lower temperature) and amplification of genomic DNA (the higher temp). However if this were the case, you would expect to see the second peak in 9B as well. Alternatively, the primers may not have crossed an intron, giving rise to the same size amplicon in cDNA and genomic DNA.
Currently it is unclear whether cDNA was amplified so RNA sample should be DNAsed and the qPCR repeated with duplicate cDNA template, negative control, and RNA negative control to determine if amplification remains after genomic carry over is eliminated.
Future steps/next directions:
eliminate genomic carry over by DNAsing sample and rerun qPCR, begin independent project.
Independent Research Project Timeline:
Research will be conducted at NWFSC so materials/reagents will be supplied.
10 Nov - Meet with Yoji, Select genes of interest, blast illumina data, design primers
17 Nov - RNA isolation/quantification
24 Nov - qPCR
1 Dec - additional qPCR/final analysis
7 Dec - Projects due/Research Presentations
Week 4: Tuesday 27 October 2009 (continued to Wednesday 28 October 2009)
Western Transfer - Immunoblots
Run PCR products on agarose gel to identify size of product, run out protein samples on gel as done previously for transfer to western blot.
Run PCR products on gel
1. placed agarose gel from last week in gel box and filled with 1x TAE buffer and removed combs.
2. Loaded 7µL 100bp ladder into far left lane of top and bottom wells
3. Loaded 25µL of my PCR sample into lower right quadrant of gel, (lower lanes 7-10)
4. Ran at 100V for 1 hour
5. Visualized on the UV transilluminator and took photos
Run Protein Gel
Mac performed as in lab 2. Briefly, assembled gel in gel box, loaded gels with 12µg sample,ran gel at 150V for 30 minutes.
Western Blot Protocol (using Invitrogen Western Breeze kit)
1. Soaked filter paper, membrane, and gel in cool transfer buffer for 15 minutes
2. assembled the blotting sandwhich (anode (+++), filter paper, nitrocellulose membrane, gel, filter paper, cathode (- - -)) in a semi-dry blotting apparatus.
3. Ran at 20V for 30 minutes
4. Remove gel from the sandwhich and rinse with transfer buffer
5. Stained gel with coomassie blue stain for 5 minutes followed by 15 minute rinses of 10% acetic acid (as in lab 2) to ensure protein was added.
6. removed any adhering gel from the membrane.
7. Placed membrane in 10mL blocking solution for 30 minutes
8. Decant blocking solution.
9. Rinse membrane with 20mL of water for 5 minutes
10. Decant water and repeat once.
11. Incubate membrane in 10mL of primary HSP70 antibody solution (1:3000 dilution) overnight
Week 4: Wednesday 28 October 2009
Western Blot continued
apply secondary antibody and visualize
1. decanted primary antibody.
2. washed membrane for 5 minutes with 20 mL of antibody wash, 3 times
3. Incubated the membrane in 10 mL secondary antibody for 30 minutes.
4. Washed the membrane for 5 minutes with 20 mL of antibody wash, 3 times
5. Rinsed membrane with 20 mL of water for 2 minutes, 2 times
6. Incubated membrane in 5 mL of Chromogenic substrate until purple bands developed on the membrane.
7. Rinsed membrane with 20 mL of water for 2 minutes, 2 times
8. Dried the membrane
Results:
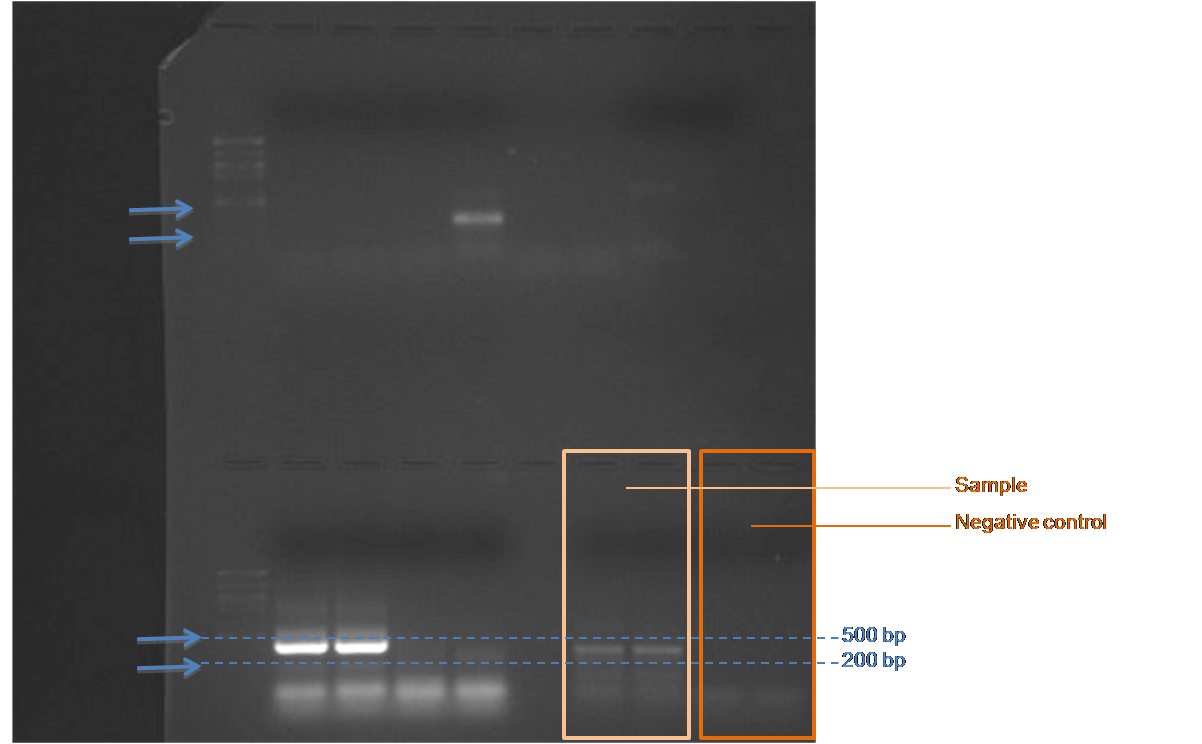
For the PCR gel, the 100kb ladder was difficult to see, however based on a best approximation, there are two brighter bands between 500bp and 200 bp and two lighter bands just below 200 bp in the two reactions with cDNA sample. In all four reactions (reactions with cDNA sample and those without) there are bands at very small bp size which probably represent primer dimer.
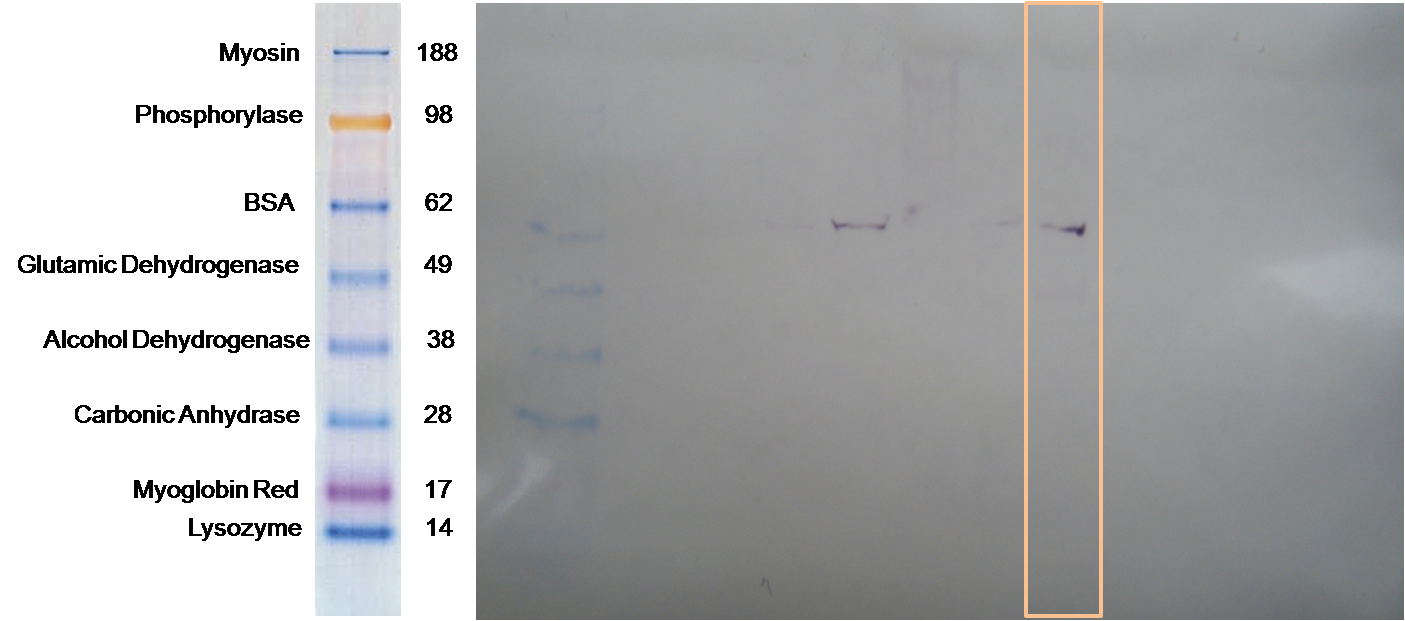
For the western blot analysis there was one band of protein in my sample that bound the HSP70 antibody. The band measured out as slightly larger than 62 kDa (using the NuPAGE MES approximate molecular weight scale). When I attempted to align the western blot photo with the protein gel photo, this is what it looked like.
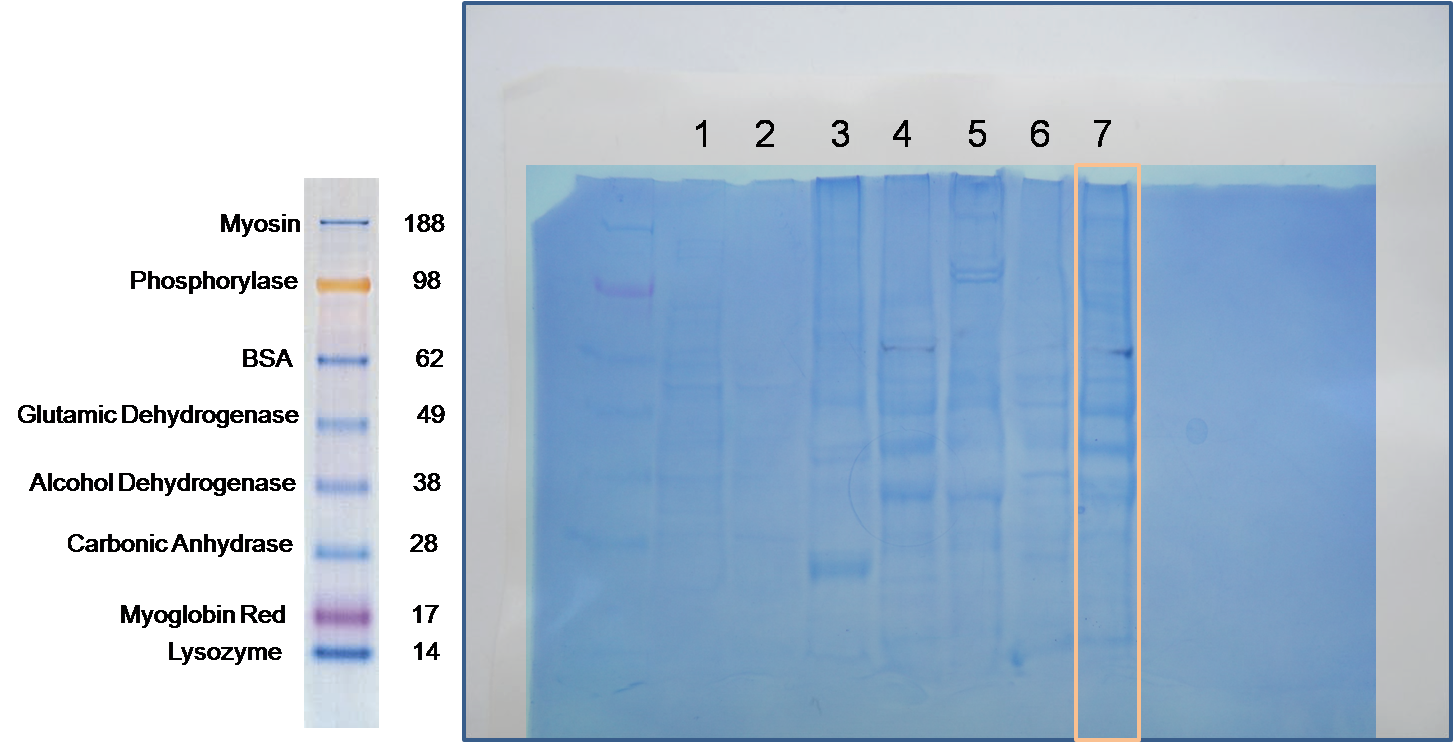
Conclusions: My primer product size was 174 bp, therefore, the lighter bands seen in the PCR gel could be indicating the target sequence, however the brighter bands that are closer to 350bp are unexpected given the projected product size. Primers were designed from Salmo salar sequence therefore, primers may have amplified a non target sequence, the target may be a different length than in the two species, or the larger bands could be representative of genomic contamination. The western blot analysis indicated presence of HSP70 protein in the herring brain at similar levels to that of sockeye salmon brain (lane 4). The herring brain (lane 7) protein banding is more similar to sockeye brain (lanes 4 and 5) than to herring heart indicating the importance of tissue type when analyzing protein expression levels.
Next steps: due to unexpected PCR product size, I would like to run my RNA sample to determine if genomic contamination is present in the sample. qPCR will also be done to quantify the amount of target cDNA present.
Week 3: Tuesday 20 October 2009
Reverse Transcription and PCR
reconstituted primers, RNA quantification, reverse transcription, PCR and agarose gel preparation
Reconstitution of primers:
added nuclease free water to primers to reconstitute and create 100µM solution. For forward primer, added 338µL of water (to 33.8nM primer). For reverse primer added 357µL water (to 35.7nM primer). Then made 10µM working solution. Put 10µL of each primer into separate, clean tubes. Added 90µL nuclease free water to each for a total volume of 100µL.
RNA Quantification:
quantified RNA on the nanodrop. wiped off pedestal, pipetted 2 µL of RNA sample onto pedestal and lowered arm. Clicked measure.
A260: 9.205
RNA concentration: 368.2 µg/µL
A260/A280 ratio: 1.88
A260/A230 ratio: 2.15
RT protocol:
1. thawed and flicked RNA sample to mix
2. transfered 5µL of RNA to a fresh PCR tube.
3. incubated at 75C for 5 mins in thermal cycler
4. transfered to ice and incubated for 5 mins
5. Added to tube:
4µL 5x AMV RT buffer
8µL dNTPs
1µL AMV RTranscriptase
1µL Oligo dT Primer
1µL RNase free water
for a total volume of 20µL
6. flicked to mix, spun quickly
7. Incubated at RT for 10 mins in thermal cycler
8. Incubated at 37C for 1 hr in thermal cycler
9. Heat inactivate @95C for 3 mins in thermal cycler
10. spun quickly
11. stored on ice (and then at -20C)
Agarose Gel preparation:
1. weighed 2g of agarose
2. measured 150mL 1x TAE in graduated cylinder
3. poured agarose and 1x TAE into a flask, mixing well.
4. microwaved solution for about 3 minutes (boiled over once) until agarose was completely dissolved
5. cooled solution briefly and added 12 µL ethidium bromide and mixed.
6. poured into gel tray with combs already set, popped any obvious air bubbles.
PCR protocol:
1. prepared pcr master mix for 5 rxns (sample in replicate, negative control in replicate, 1 extra for pipetting error)
125µL GoTaq Green Master Mix, 2X
12.5µL forward primer, 10µM
12.5µL reverse primer, 10µM
90µL nuclease free water
2. labeled 4 PCR tubes LH1 through LH4
3. added 48µL master mix to each PCR tube
4. added 2µL cDNA into LH1 and LH2
5. added 2µL nuclease free water into LH3 and LH4
6. Left samples in pcr tubes on ice to be loaded into thermocycler
thermal profile:
95C - 10 mins
40 cycles: 95C - 30 sec, 55C - 30 sec, 72C - 30 sec
72C - 3 mins
4C forever
Conclusions/Next steps:
RNA Quantification (A260: 9.205, RNA concentration: 368.2 µg/µL, A260/A280 ratio: 1.88, A260/A230 ratio: 2.15) suggests that RNA is pretty clean (I didn't totally mess up that whole EtOH drying step!)
Next steps, run protein gel/western blot, run PCR products out on gel to determine: if primers worked and if genomic contamination was present
Week 2: Tuesday 13 October 2009
Tissue Extraction 2:
Ran protein on SDS-PAGE protein gel. Finished RNA isolation.
Protein Gel Protocol:
1. Observed Mac assemble the gel (4-20% Tris-HEPES SDS-PAGE gel) in the gel box, and rinse gel wells.
2. Thawed protein extract and mixed well by inverting.
3. Added 15µL protein and 15µL 2X Reducing Sample Buffer to clean 1.5mL screw cap tube.
4. Mixed by flicking, spun briefly.
5. Boiled sample for 5 minutes.
6. Immediately spun for 1 minute.
7. Slowly loaded gel. I loaded 28µL of sample into well 8.
8. Mac put lid on gel box, plugged in electrodes, and turned on power supply, setting voltage to 150V. Watched for bubbles to ensure gel box was properly set up.
9. Gel ran for approximately 30 minutes.
10. Mac turned off power supply, and disassembled the gel from the gel box.
11. Submerged gel in coomassie stain and incubated on rocker for 5 minutes.
12. Caroline poured stain back into original container, rinsed gel briefly with 10% acetic acid, poured the wash down the drain, submerged the gel in fresh10% acetic acid and incubated on rocker for 15 minutes.
13. Changed buffer after 15 minutes and continued to incubate on rocker.
14. Gel was photographed after approximately 90 minutes of rinsing, when bands were clearly visible.
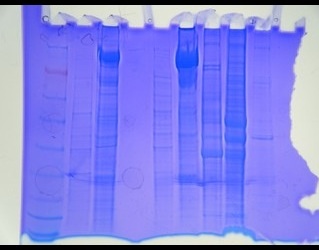
gel was loaded with:
well 1: 10µL Seeblue Plus 2 Prestained Standard ladder (Invitrogen)
2: Emma - Vt + oyster
3: Sarah - heat shocked barnacle
4: *BLANK
5: Elene - 9.165µg Vt
6: Sonia - heat shocked barnacle
7: Caroline - 9.5µg Sockeye brain
8: Louisa - 16.178µg herring brain protein
9: Sean - Bay scallop
10: *BLANK
11: *BLANK
12: *BLANK
Results/Calculations:
1155.59µg/mL * 14µL* 1mL/1000µL = 16.178µg
Amount of protein loaded into gel was 16.178 µgTuesday 6 October 2009 (Entered 12 October 2009)
Generally, it seems like 16µg of protein was more than necessary. Three major bands are visible. The first appears at 49kDa (associated with glutamic dehydrogenase), the second between 49 and 38 kDa and the last near 38 kDa (associated with alcohol dehydrogenase) where approximate molecular weights refer to the NuPAGE MES scale.
There was high variability between protein concentrations at the end of the first week which could have been due to, pipetting error, absorbance of pigment in the sample, if the spectrophotometer happened to hit on a piece of shell or other debris in the sample or of course, real variability in concentrations. given the variability in the protein levels seen in the gel, it would appear that at least some of the variability seen in last week's protein quantification, is in fact, differences in protein concentration.
RNA Isolation Continued...
1. Thawed sample and inverted to mix.
2. Incubated at RT for 5 minutes
3. In fume hood, added 200µL of chloroform.
4. Vortexed for 30s. (Milky emulsion was observed).
5. Incubated at RT for 5 minutes
6. Spun tube in refrigerated microfuge for 15 minutes at max speed.
7. Transfered aqueous phase (top, clear portion) to clean tube.
8. Added 500µL isopropanol to RNA sample
9. Mixed by inverting until solution appeared uniform.
10. Incubated at RT for 10 minutes.
11. Spun in refrigerated microfuge at max speed for 8 minutes.
12. Removed supernatant (small white pellet observed).
13. Added 1mL of 75% EtOH to pellet. Closed tube and vortexed briefly. (pellet did dislodge)
14. Spun in refrigerated microfuge at 7400g for 5 minutes.
15. Removed supernatant. (pellet is still visible). Spun briefly, removed remaining EtOH.
16. Left tube open to allow pellet to dry. (Had difficulty drying. Left to dry approximately 8.5 minutes. Not positive that EtOH had completely evaporated).
17. Resuspended pellet in 100µL of 0.1%DEPCH2O by flicking
18. Incubated at approximately 57 C for 5 minutes.
19. Removed tube from heat. Flicked to mix and placed on ice.
Did not have time to complete RNA Quantification. Quantification postponed until next week.
Next steps: Did not have time to complete RNA Quantification. Next week we will quantify RNA, reverse transcribe RNA to cDNA and perform qPCR.
Week 1: Tuesday 6 October 2009
Tissue Extraction 1:
Begin RNA isolation. Protein Isolation and Quantification
RNA Isolation:
1. Received a sample of pre-weighed (Atlantic?) Herring brain
2. Added 1000µL TriReagent to tube (yes, all at once).
3. Carefully homogenized tissue with disposable pestle
4. Vortexed vigorously for 15s.
Protein Extraction:
1. Received second sample of pre-weighed herring brain.
2. Added 500µL Cell Lytic MT to tube.
3. Homogenized with disposable pestle
4. Closed and inverted tube
5. Spun 10 minutes at max speed in refrigerated microfuge
6. Transfered supernatant to clean, labeled tube.
Protein Quantification:
1. Transfered 15µL of sample into clean, labeled 2mL tube.
2. Added 15µL deionized water
3. Added 1.5mL bradford reagent.
4. Placed remaining protein on ice.
5. Prepped blank (30µL deionized water + 1.5mL bradford reagent)
6. Inverted and incubated 10 minutes at RT
7. Inverted tubes to mix again and transferred 1mL of each to clean cuvettes
8. Zeroed spectophotometer to the blank
9. Measured sample absorbance at 595
Sample absorbance at 595 was 0.571
(Failed to mix again and remeasure absorbance. Therefore cannot average values).
10. Stored remaining protein in fridge.
Results/Observations/Calculations:
Y = 1011.9X where Y is equal to the half the concentration of the sample (due to dilution)
Y = 1011.9 (0.571)
Y = 577.79 µg/mL
Concentration = 1155.59 µg/mL
Primer Design:
Because I will be studying fish reproductive biology and endocrinology, I wanted to choose a gene involved in regulating the reproductive system. And since my tissue is a brain, I needed to choose a gene expressed in the brain. As such I decided to look at Gonadotropin-Releasing Hormone (GnRH) for the availability of the herring sequence in GenBank and information in the literature. The herring (Clupea halgerus) GnRH sequence found in GenBank (CS179453) was only 30 base pairs long. Due to it's shortness, I blasted the sequence for similar sequences. I selected the Salmo salar GnRH sequence (NM_001123667) which was 93% identical to the herring sequence between 115-144 bps. and selected this sequence to design my primers from. I used the SciTools at www.idtdna.com to design primers ensuring that the 115-144 bp section was being amplified. The selected primers are as follows:
| Forward Primer |
|||||||||
| Primer Sequence: |
TTAGCAACAGAACGGTTGTGCAGG |
||||||||
| Primer Start Position: |
53 |
Primer Length: |
24 |
||||||
| Primer TM: |
59.7 ºC |
Primer Self Any: |
7.0 |
||||||
| Primer GC %: |
50.0 % |
Primer Self End: |
3.0 |
||||||
| Primer End Stability: |
6.81 |
Primer Penalty: |
0.34 |
||||||
| Reverse Primer |
|||||||||
| Primer Sequence: |
TTGTCTCCTCAGGAAGAGCCACTA |
||||||||
| Primer Start Position: |
226 |
Primer Length: |
24 |
||||||
| Primer TM: |
58.8 ºC |
Primer Self Any: |
8.0 |
||||||
| Primer GC %: |
50.0 % |
Primer Self End: |
2.0 |
||||||
| Primer End Stability: |
4.75 |
Primer Penalty: |
1.23 |
||||||
| Primer Pair/Product |
|||||||||
| Primer Pair Penalty: |
1.57 |
Primer Pair Comp Any: |
3.0 |
||||||
| Primer Product Size: |
174 |
Primer Pair Comp End: |
0.0 |
||||||